Project Summary
In this project, I explored how GIS can be used to model and visualize wildfire susceptibility across Alberta. Using official datasets and ArcGIS Pro, I created a wildfire risk surface that highlights vulnerable regions—particularly those with steep slopes, coniferous vegetation, and proximity to recent wildfire activity.
This study demonstrates how spatial data can inform wildfire preparedness and ecological planning by integrating terrain, vegetation, and fire history into a unified model.
Objectives
- Classify vegetation types based on species, conifer density, and time since last disturbance
- Derive slope and aspect from Alberta’s 25m provincial DEM
- Incorporate historical wildfire perimeters (1931–2024)
- Perform weighted overlay analysis to map areas at highest wildfire risk
- Identify rural municipalities most affected by extreme risk zones
Data Sources Used
- PLVI (Primary Land and Vegetation Inventory) – Species composition, tree cover, and disturbance history
- Provincial DEM – For slope and aspect classification
- Wildfire Perimeters – From 1931 to 2024 (filtered for recent fires post-2000)
- Municipal Boundaries – For spatial analysis of affected jurisdictions
Methodology Overview
1. Vegetation Classification
Using a custom classify_fire_risk() function in Python, I evaluated dominant species (e.g., spruce, pine, aspen), conifer percentage, and disturbance year to assign low (1), moderate (2), or high (3) risk levels.
2. Terrain Modeling
Slope and aspect were calculated from the provincial DEM. South-facing slopes and steep terrain were weighted higher for their influence on fire spread.
3. Proximity to Past Fires
Fires from 2000–2024 were buffered by 2 km to account for areas with increased ignition likelihood.
4. Weighted Overlay Analysis
Each raster layer was assigned an influence percentage:
- Vegetation Risk – 30%
- Slope – 30%
- South Aspect – 20%
- Fire Proximity – 20%
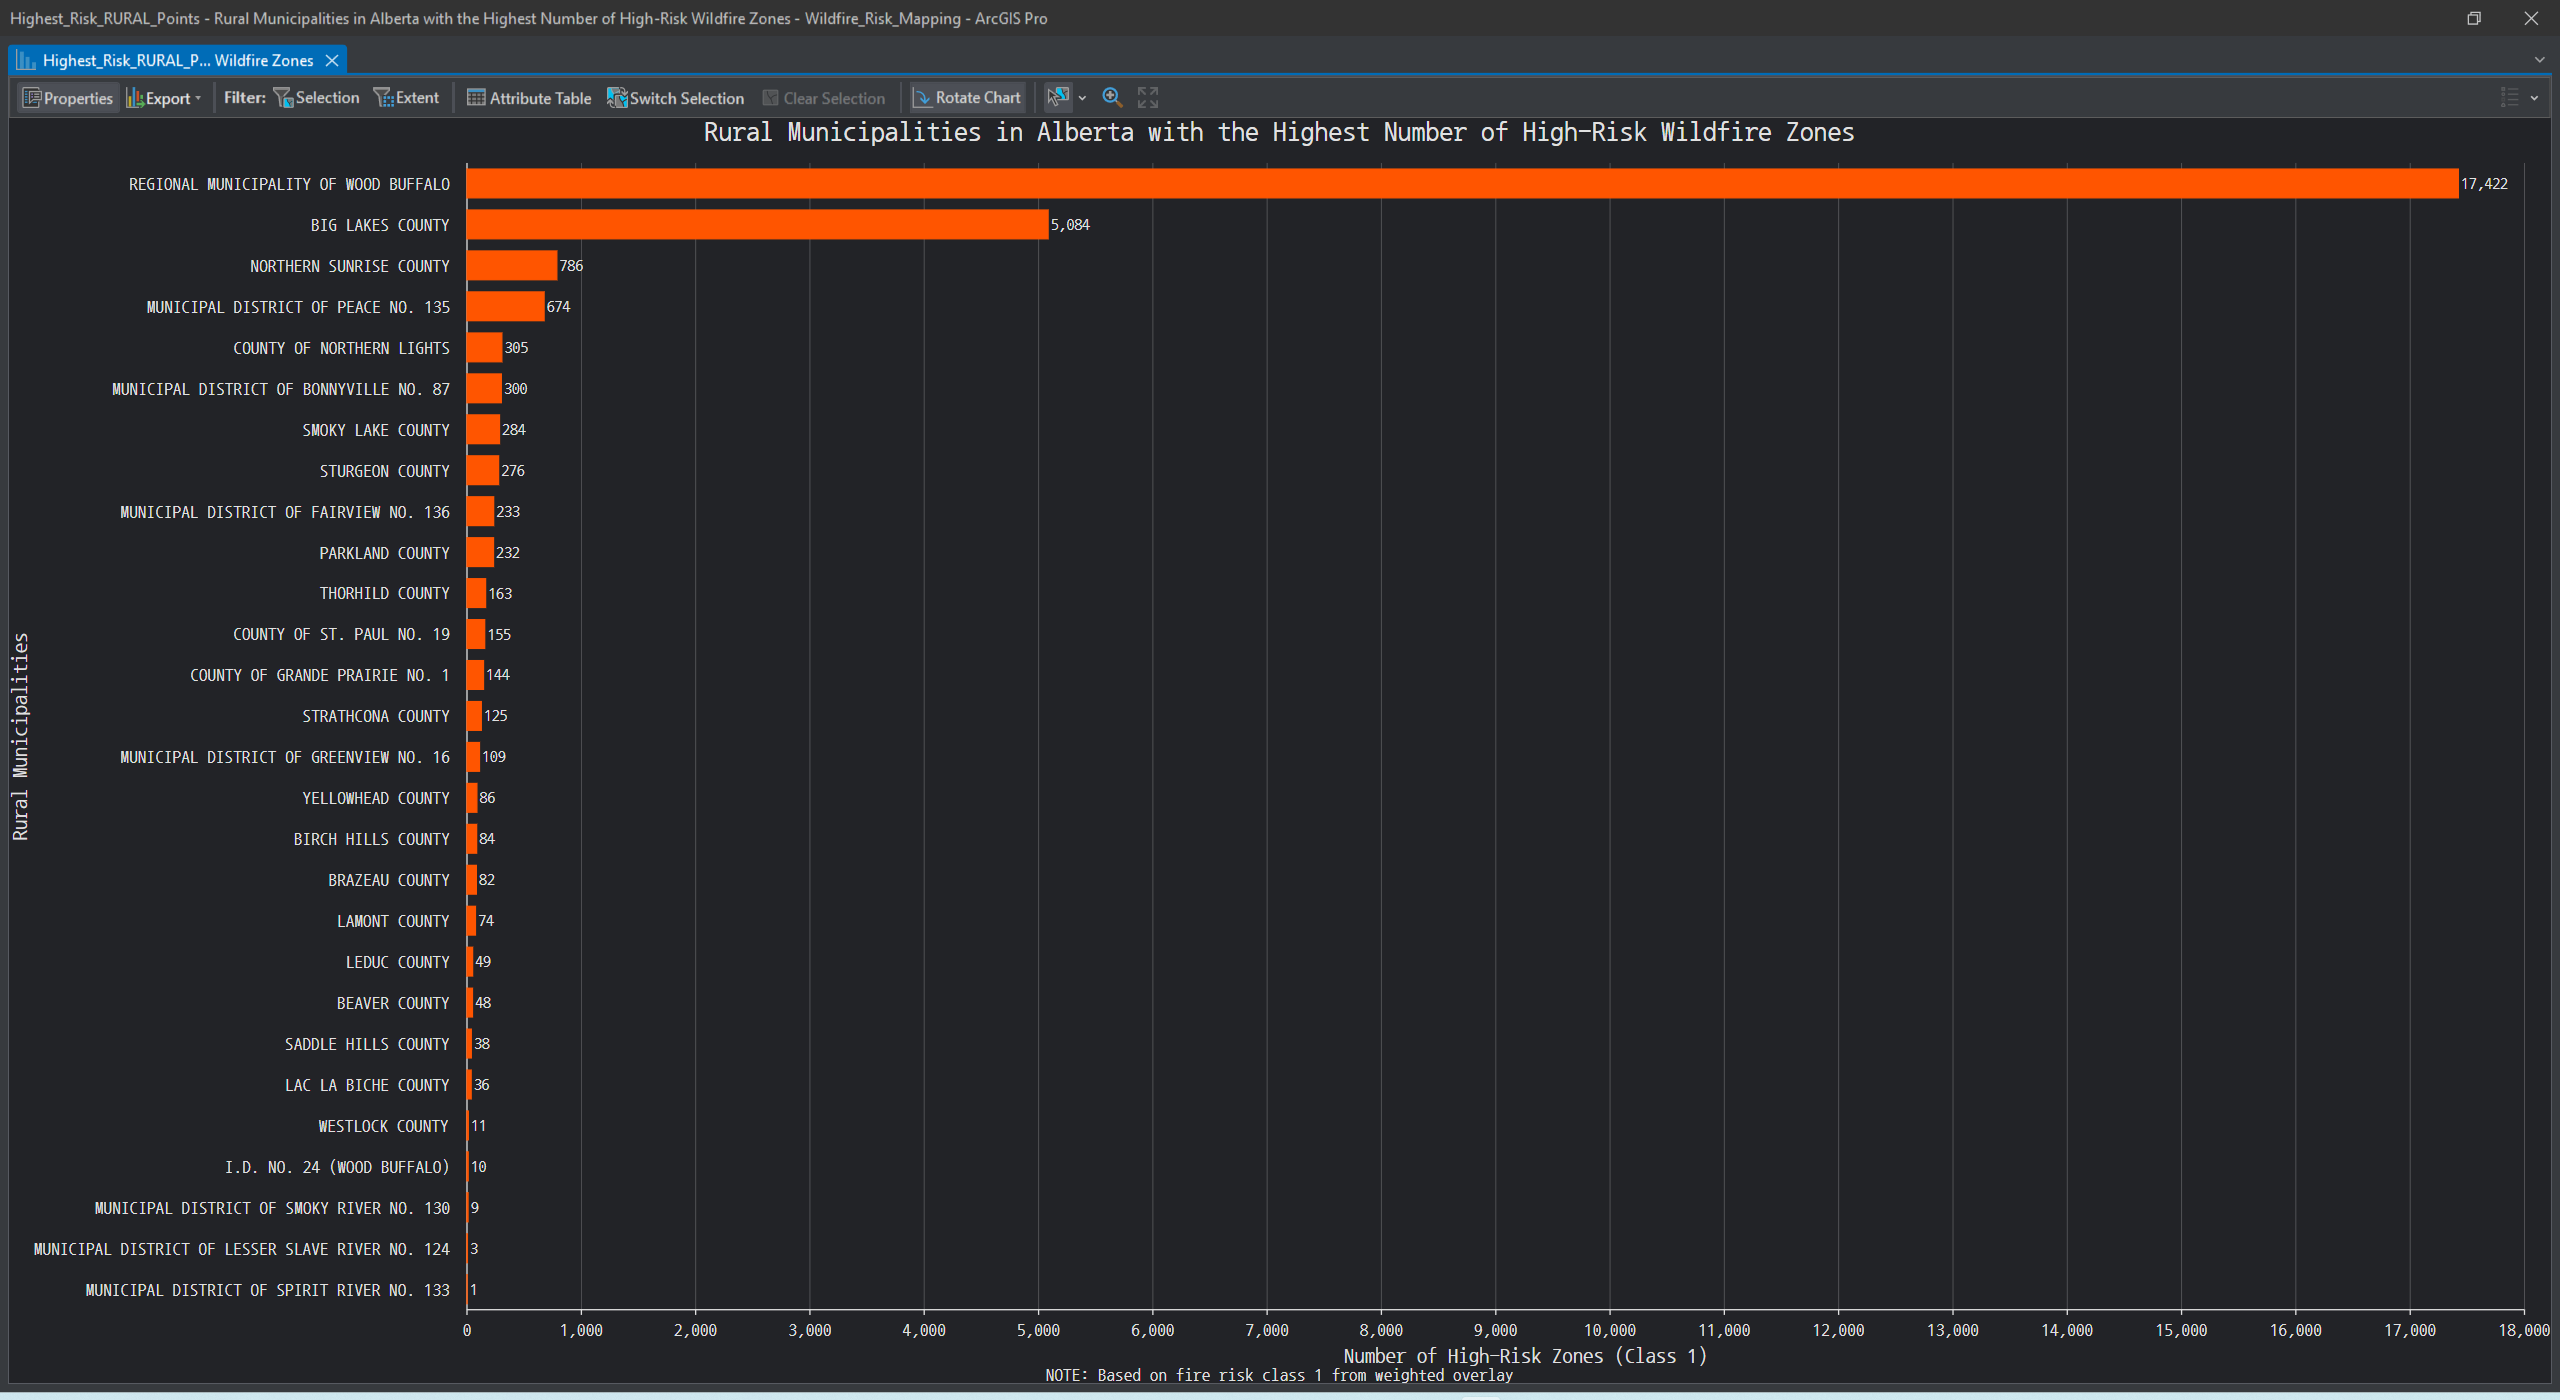
5. Intersecting with Rural Boundaries
The highest fire risk zones were intersected with rural municipal boundaries to identify communities requiring urgent fire mitigation efforts.
Key Findings
- The Regional Municipality of Wood Buffalo, Big Lakes County, and Northern Sunrise County had the highest density of Class 1 fire risk zones.
- Most high-risk zones were concentrated in Alberta’s northwest, around Grande Prairie, and south of Fort McMurray.
- Less than 0.1% of the mapped area fell into the lowest risk class.
Recommendations
- Mitigation Priority: Focus on high-risk municipalities for vegetation thinning and emergency planning.
- Planning Integration: Use fire risk zones in resource allocation and evacuation strategies.
- Update with New Data: Reassess using up-to-date PLVI, LiDAR, and satellite imagery.
Next Steps
- Integrate live fire detection (MODIS, VIIRS) for real-time monitoring
- Expand classification to Alberta’s Boreal region using AVI
- Include infrastructure vulnerability (roads, pipelines, urban zones)
- Package tools and models for reuse across regions or in classrooms
Appendix Highlight: What Are MODIS and VIIRS?
MODIS and VIIRS are satellite instruments that provide real-time thermal anomaly detection. They are key to integrating live wildfire monitoring into GIS-based risk models like this one. Learn more in the [full PDF report].