Introduction
Alberta’s vast public lands serve a dual purpose: supporting industrial development and conserving ecological integrity. But what happens when the smaller, less-regulated leases—classified as “incidental activities”—start stacking up across the landscape?

In this GIS portfolio project, I conducted a spatial analysis of Alberta’s oil and gas infrastructure, focusing on incidental land uses such as temporary access roads, staging areas, and maintenance zones. These seemingly minor leases, when mapped, reveal surprising clusters, overlaps, and proximity conflicts with protected areas.
The goal? Visualize the invisible—to help land managers, regulators, and planners make better-informed decisions through spatial insight.
Tools & Techniques Used
- ArcGIS Pro for spatial joins, buffer analysis, kernel density mapping, and symbology.
- Python (Jupyter Notebooks) for statistical summaries, overlap detection, and value counts using
pandasand spatial libraries. - Datasets: ST102 Facility Points, PLA Disposition Polygons, Township Grid (LLDs), and Parks & Protected Areas of Alberta.
Project Highlights
1. Incidental Lease Overlap
A 2,000-meter buffer was applied around incidental leases. Overlap analysis showed that some facilities had up to 18 overlapping approvals, signaling redundant development and potential land fragmentation.

2. Hotspot Detection Using Getis-Ord Gi*
By analyzing the Join_Count of leases within a 5,000-meter radius, spatial clusters of high-intensity leasing were identified. These hotspots suggest regions with intensified cumulative impact, often overlooked in individual approvals.

3. Intersection with Protected Areas
Two TAQA North Ltd. facilities were found to encroach within 2,000 meters of Chambers Creek Provincial Recreation Area, raising serious questions about oversight in sensitive zones.


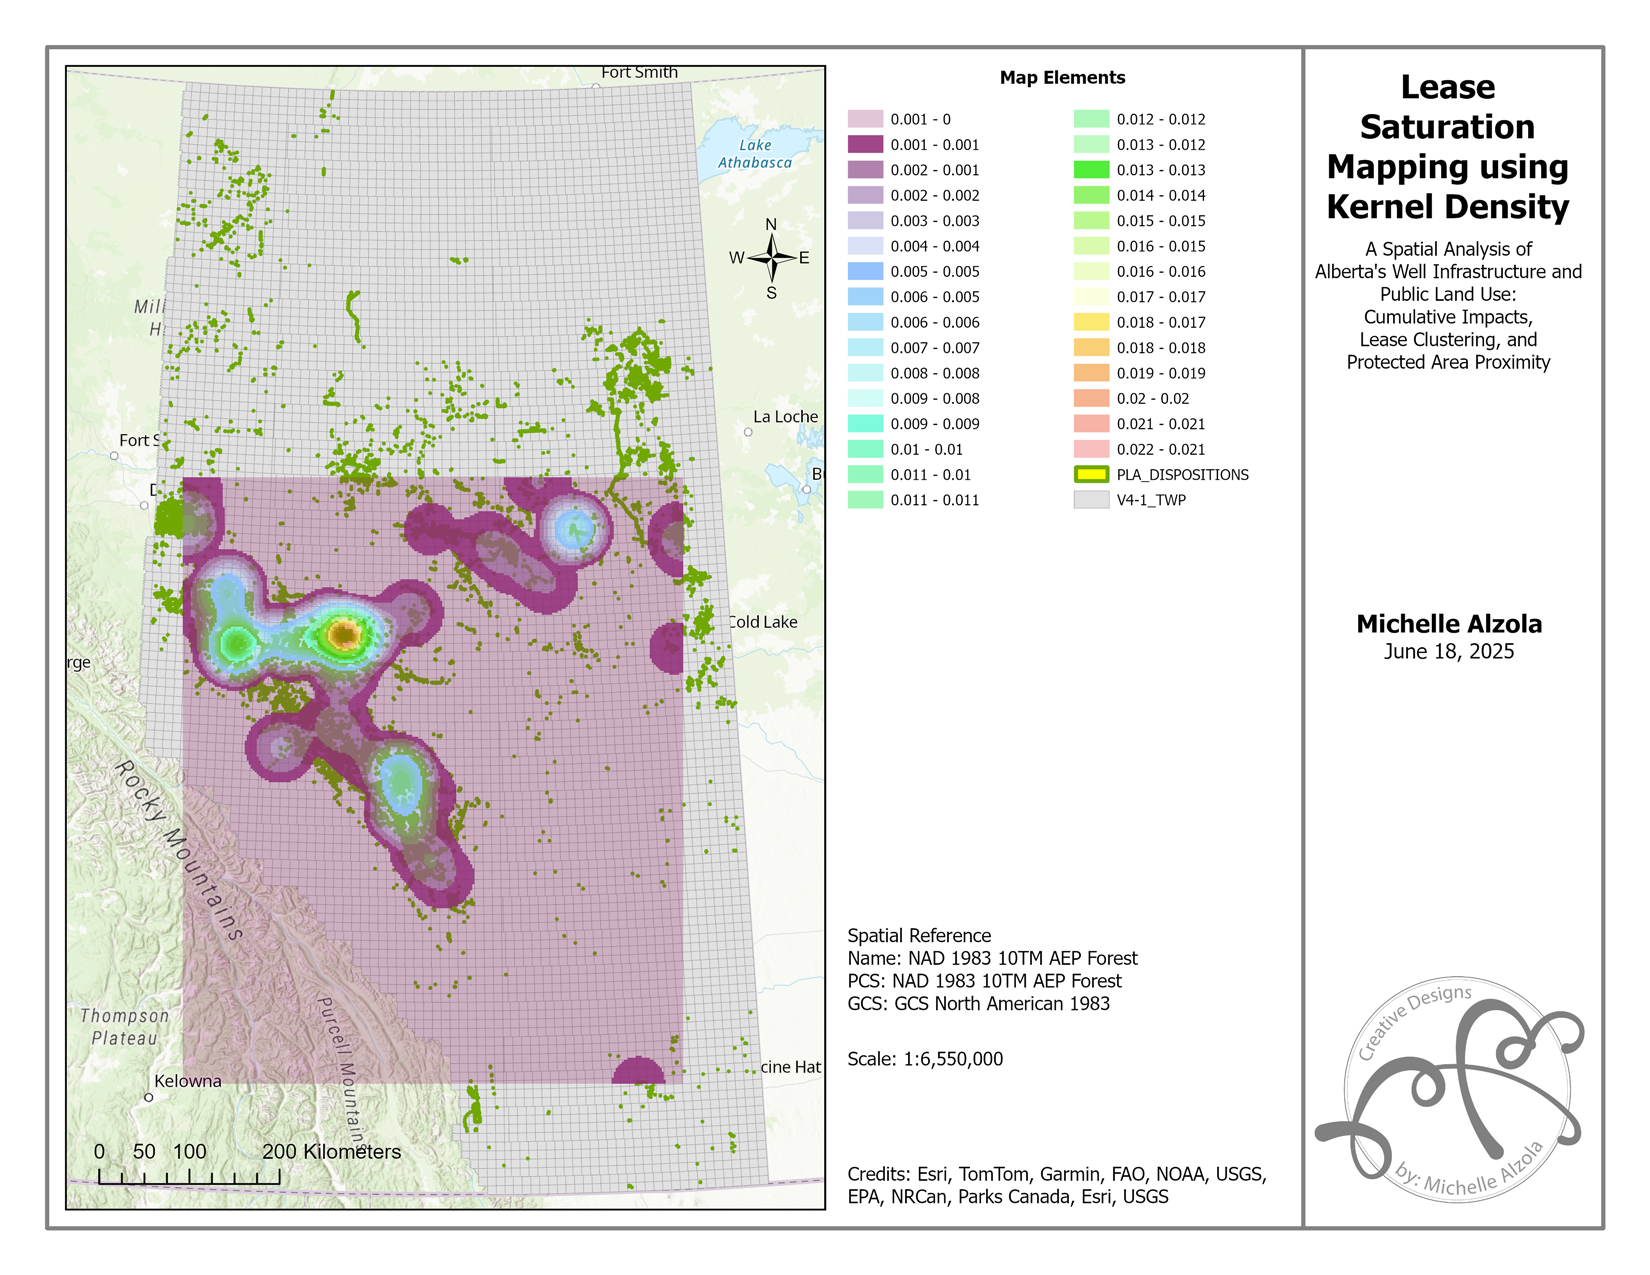
4. Kernel Density Surface
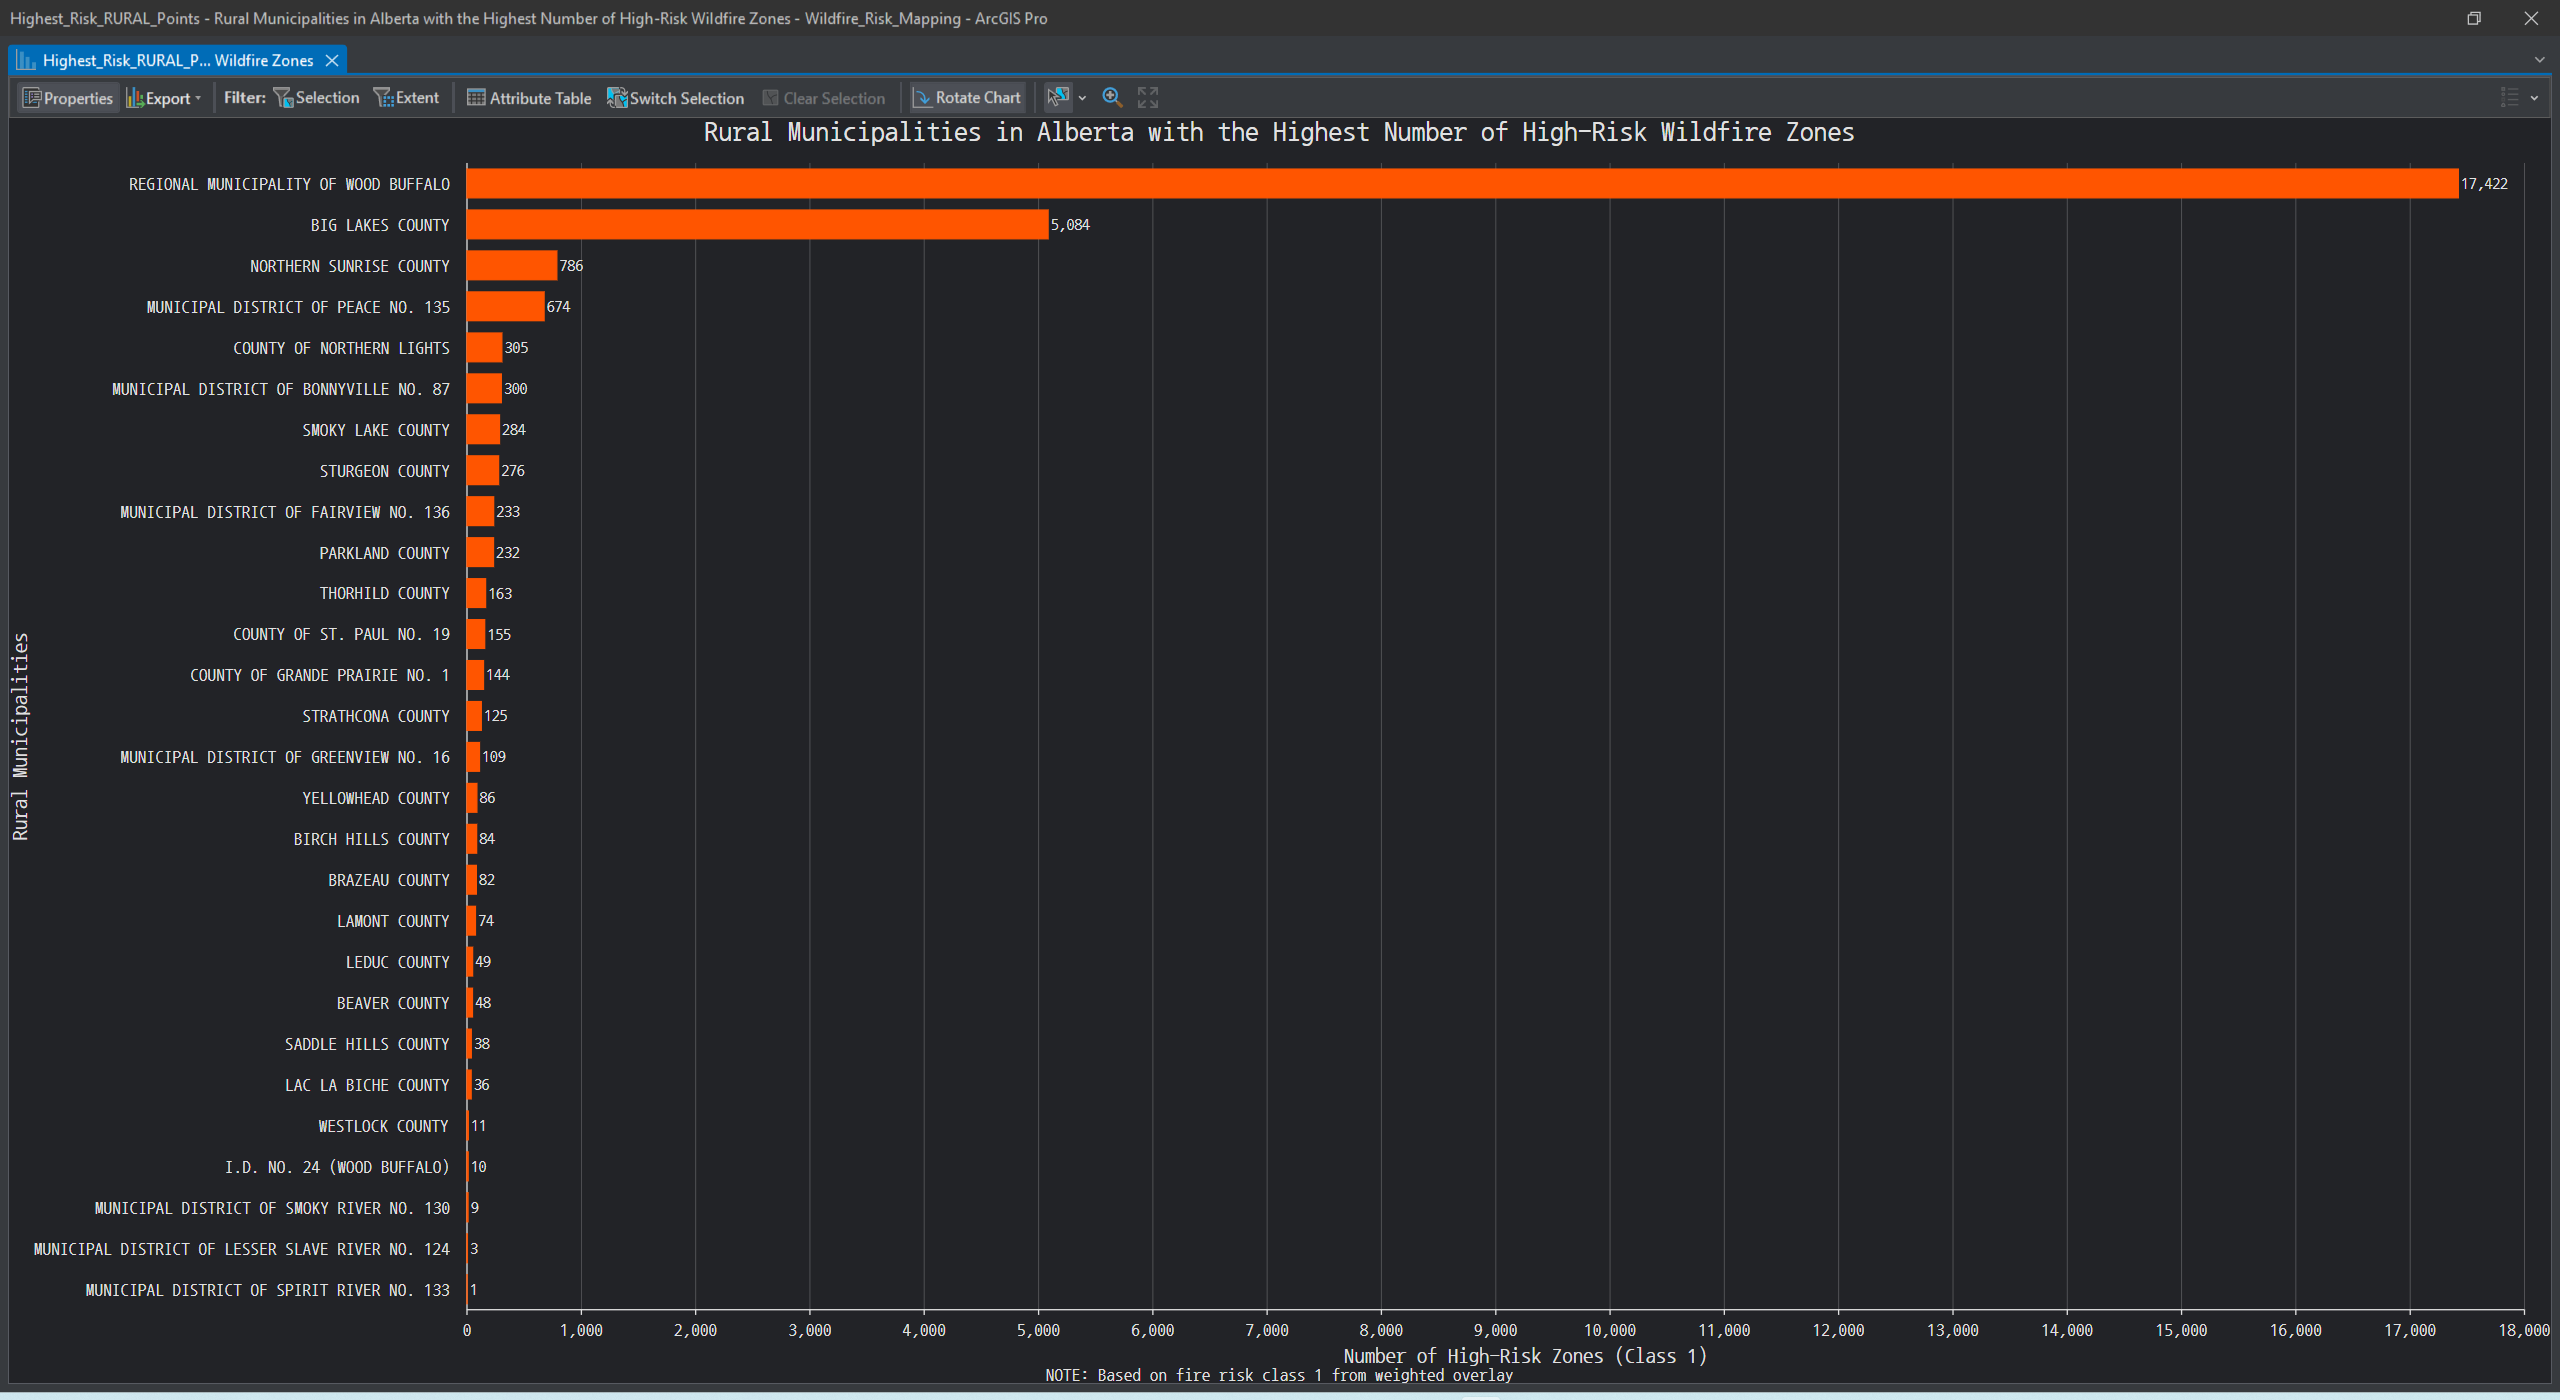
Using Kernel Density Estimation (KDE), a 30-class raster surface was created to visualize saturation of incidental activity across Alberta. Results highlighted Southwestern and Central Alberta as critical zones of lease accumulation.

Policy & Planning Implications
This spatial evidence supports the urgent need for:
- Buffer-based approval checks
- Cumulative activity zones (IACZs)
- Operator-level lease audits
- Joint spatial dashboards between AER and AEPA
Rather than treating incidental leases as minor, regulators must consider their collective environmental footprint.
Read the Full Report
📄 Download PDF Report
💻 View Project Code and Notebooks
Final Thoughts
This project helped me merge regulatory data with geographic insight—bridging the gap between policy documentation and real-world spatial footprints. It’s a reminder that small leases can lead to big consequences when not monitored as a whole.
Feel free to fork the project or contact me if you’re working on land-use planning, energy impact studies, or conservation GIS.