The basic principle in Geographic Information Systems (GIS) is that all map layers must align spatially when used together (Chang, 2019). Spatial alignment ensures that information is accurate, meaningful, and not misleading.
Below is a map displaying several layers of the city of Calgary, including district boundaries (City of Calgary, Community Boundaries, n.d.), major road networks (City of Calgary, Major Road Network- CTP Class, n.d.), and road construction projects (City of Calgary, Road Construction Projects map, n.d.). Consider how confusing or incorrect decisions could become if these layers are not aligned properly.

When layers are misaligned, errors and distortions occur. For example, infrastructure planning, emergency response, and general navigation could all be compromised. Accurate spatial representation is fundamental for effective decision-making in urban planning and transportation management.
Why Map Projections and Coordinate Systems Matter
The map I provided uses the WGS84 (DD) Geographic Coordinate System. However, notice that the layers appear stretched and distorted. Geographic Coordinate Systems represent the earth as a sphere and use latitude and longitude coordinates in degrees. While useful for global positioning, they often cause distortion when directly visualizing or analyzing local spatial data.
To solve this issue, GIS professionals rely on Projected Coordinate Systems. Projected Coordinate Systems transform three-dimensional geographic data onto two-dimensional maps using various map projections. Each projection attempts to minimize distortion in shape, area, distance, or direction, but no single projection can preserve all these properties simultaneously.
Projection and Reprojection
One of the initial tasks performed in GIS is the projection and reprojection of spatial data to ensure accurate alignment and analysis.
Map projection is the systematic process of converting geographic coordinates from a three-dimensional curved ellipsoid onto a two-dimensional Cartesian surface or flat map for spatial analysis (Bolstad & Manson, 2022). This is important for the spatial datasets to match the scale, area and distance properties required for specific GIS analyses.
Reprojection converts spatial data from one projected system to another to align datasets from different projections (Chang, 2019). This method is used to integrate multiple datasets that use varying projections to maintain spatial accuracy. Mismatched coordinate systems can result in misaligned map layers, error in distance and spatial relationships that are distorted.
Geographic Coordinate System
Defined by latitude and longitude, the Geographic Coordinate System (GCS) serves as a reference framework for identifying spatial features and topographic locations on Earth’s surface (Chang, 2019). It is a fundamental system in Geographic Information Systems (GIS) that facilitates precise mapping, navigation, and spatial analysis through a globally recognized method of positioning.

Key Components of GCS
Latitude (North-South Measurement)
- Latitude lines run parallel to the Equator (0° latitude).
- They measure how far north or south a point is from the Equator.
- Values range from +90° (the North Pole) to -90° (the South Pole).
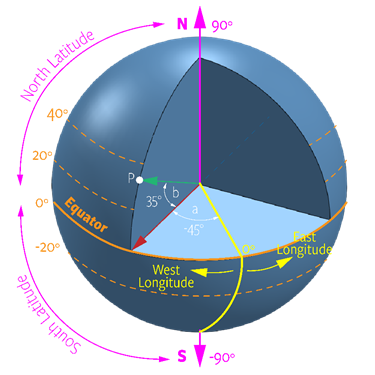
- In the illustration:
- The magenta arrows indicate 90°N (North Pole) and -90°S (South Pole).
- The orange dashed lines represent latitude parallels at different degrees (e.g., 40°, 20°, -20°).
- Why It Matters: Latitude helps determine climate zones, time zones, and global positioning.
Longitude (East-West Measurement)
- Longitude lines, or meridians, converge at the poles and measure angular distance east or west of the Prime Meridian (0° longitude).
- Values range from -180° (West) to +180° (East).
- In the illustration:
- The yellow line represents the Prime Meridian (0° longitude).
- The yellow arrow labeled “West Longitude” shows westward measurements.
- The yellow arrow labeled “East Longitude” represents eastward measurements.
- Why It Matters: Longitude is crucial for determining time zones, navigation, and global positioning systems (GPS).
Coordinate Representation (Latitude, Longitude)
- Every point on Earth is identified using a coordinate pair:
- (Latitude, Longitude)
- Latitude is listed first, followed by Longitude.
- In the illustration:
- The white point “P” represents a specific geographic location.
- The angle “a” (-45° longitude, west) shows the horizontal position of point P.
- The angle “b” (35° latitude, north) indicates the vertical position of point P.
- Why It Matters: This system ensures precise positioning for GPS tracking, navigation, and spatial data analysis.
Reference Lines in GCS
- The Equator (0° Latitude) [Orange Line]
- Divides the Earth into the Northern and Southern Hemispheres.
- Acts as the baseline for measuring latitude.
- The Prime Meridian (0° Longitude) [Yellow Line]
- Divides the Earth into the Eastern and Western Hemispheres.
- Acts as the baseline for measuring longitude.
- Why They Matter: These reference lines are fundamental to global positioning, mapping, and geospatial calculations.
Map Projections
Working with an ellipsoid to represent the Earth’s surface presents significant challenges due to its complex curvature. As a result, many geographic and cartographic studies simplify this by using a flat, two-dimensional representation of the Earth’s surface. To achieve this transformation from a three-dimensional ellipsoidal model to a two-dimensional map, cartographers utilize one of three primary types of mathematical projections: planar (also known as azimuthal), cylindrical, and conical projections (Burrough, McDonnel, & Lloyd, 2014). Each of these projection methods employs different geometric principles to project the Earth’s surface onto a flat plane, and the choice of projection depends on factors such as the region being mapped, the purpose of the study, and the type of distortion that can be tolerated.
Note: For a detailed overview of the map projections supported in ArcGIS Pro, including planar (azimuthal), cylindrical, and conical projections, visit the official documentation: List of Supported Map Projections in ArcGIS Pro.
1. Cylindrical Projection (Price, 2023)

| Definition | In this projection, the Earth is projected onto a cylinder that is then unrolled into a flat surface. This method is commonly used for world maps. |
| Distortions | Minimal near the equator but increases toward the poles, significantly distorting areas, making high-latitude regions (e.g., Greenland and Antarctica) appear much larger than they are. |
| Usage | Used for navigation, global maps, and climate data visualization. |
| Examples | Mercator Projection: Often used for nautical navigation since it preserves direction. Robinson Projection: A compromise projection balancing distortion across shape, size, and distance |
2. Conic Projection (Price, 2023)

| Definition | The Earth’s surface is projected onto a cone, which is then unwrapped. This projection is typically applied to mid-latitude regions. |
| Distortions | Minimal along the standard parallel (usually a mid-latitude line), but distortions increase away from this line. |
| Usage | Suitable for regional and country-level mapping of areas that stretch predominantly east-west, such as the United States and Europe. |
| Examples | Albers Equal-Area Conic: Preserves area, making it useful for thematic and population-density maps. Lambert Conformal Conic: Used for aeronautical charts because it preserves shape and direction. |
3. Azimuthal (Planar) Projection (Price, 2023)

| Definition | Projects the Earth’s surface onto a flat plane, typically from a central point. |
| Distortions | Minimal near the center of the projection but increases toward the edges, making it unsuitable for large-scale maps. |
| Usage | Best for mapping polar regions, airline navigation, and radio signal coverage. |
| Examples | Stereographic Projection: Used for polar maps because it maintains angles and directions from the center. Gnomonic Projection: Used in air navigation since great circle routes (the shortest path between two points on a sphere) appear as straight lines. |
Selecting the Appropriate Projection
Choosing the right map projection depends on the project’s focus:
- Cylindrical projections, such as Mercator, maintain accurate directions but distort areas, especially toward the poles.
- Conic projections, like Lambert Conformal Conic, are ideal for mid-latitude regions and effectively balance shape and area.
- Planar (Azimuthal) projections excel for polar regions and emphasize accurate direction or distance from a specific point.
Why Alberta 3TM Reference Meridian 114°W is Best for Calgary (epsg.io, n.d.)

The Alberta 3TM (3-Degree Transverse Mercator) projection system is a modified Transverse Mercator (TM) projection used specifically for Alberta to reduce distortions in large-scale mapping. The system divides Alberta into zones with central meridians spaced every 3 degrees of longitude to minimize distortion.
1. Calgary’s Geographic Location
- Calgary is located at approximately 114°W longitude.
- The Alberta 3TM system uses central meridians at 111°W, 114°W, and 117°W to cover different parts of the province.
- Since Calgary lies near the 114°W meridian, it falls within the optimal zone of the Alberta 3TM reference meridian 114°W.
2. Reduced Distortion
- The Transverse Mercator projection is best suited for north-south-oriented areas because it minimizes distortion along the central meridian.
- By using a 3-degree zone width (instead of the standard 6-degree UTM zones), the Alberta 3TM system further reduces distortions in distance, shape, and area measurements.
- Since Calgary is close to 114°W, maps and GIS analyses using Alberta 3TM 114°W will have minimal distortion.
3. Improved Accuracy for Engineering & Municipal Applications
- The 3-degree zone width provides higher accuracy than broader systems like UTM (which uses 6-degree zones).
- Surveying, engineering, and municipal GIS applications in Calgary require accurate spatial data, and Alberta 3TM 114°W provides a better fit than UTM.
- Land development, infrastructure planning, and cadastral mapping benefit from using the most geographically appropriate coordinate system.
4. Government and Industry Standard in Alberta
- The Alberta government and many municipalities (including Calgary) use Alberta 3TM with the appropriate reference meridian for official mapping.
- Oil & gas, construction, and transportation sectors in Calgary and surrounding areas rely on Alberta 3TM for accurate project planning.
Conclusion
The Alberta 3TM Reference Meridian 114°W is the best choice for Calgary because it:
- Minimizes distortion due to Calgary’s proximity to 114°W.
- Provides higher accuracy than broader systems like UTM.
- Is the standard projection for government, engineering, and GIS applications in Calgary.
- Supports precise surveying, cadastral mapping, and urban planning in the city and surrounding areas.
Final Thoughts
Understanding and correctly applying map projections and coordinate systems are vital to the integrity and effectiveness of GIS projects. Proper spatial alignment ensures accuracy and helps communicate clear, actionable information for better decisions and effective outcomes in GIS applications.
References
Bolstad, P., & Manson, S. (2022). GIS Fundamentals: A First Text on Geographic Information Systems, 7th Edition. White Bear Lake, Minnesota: Eider Press .
Burrough, P. A., McDonnel, R. A., & Lloyd, C. D. (2014). Principles of Geographical Information Systems Third edition. New York: Oxford University Press .
Chang, K.-t. (2019). ISE Introduction to Geographic Information Systems, 9th Edition. New York: McGraw-Hill Higher Education.
City of Calgary. (n.d.). Community Boundaries. Retrieved from data.calgary.ca: https://data.calgary.ca/Base-Maps/Community-Boundaries/ab7m-fwn6
City of Calgary. (n.d.). Major Road Network- CTP Class. Retrieved from data.calgary.ca: https://data.calgary.ca/Transportation-Transit/Major-Road-Network-CTP-Class/xywe-d5rg
City of Calgary. (n.d.). Road Construction Projects map. Retrieved from data.calgary.ca: https://data.calgary.ca/Transportation-Transit/Road-Construction-Projects-map/kjkw-394k
epsg.io. (n.d.). EPSG:3780. Retrieved from epsg.io: https://epsg.io/3780
Price, M. (2023). ISE Mastering ArcGIS Pro, 2nd Edition. New York: McGraw Hill LLC.